Views
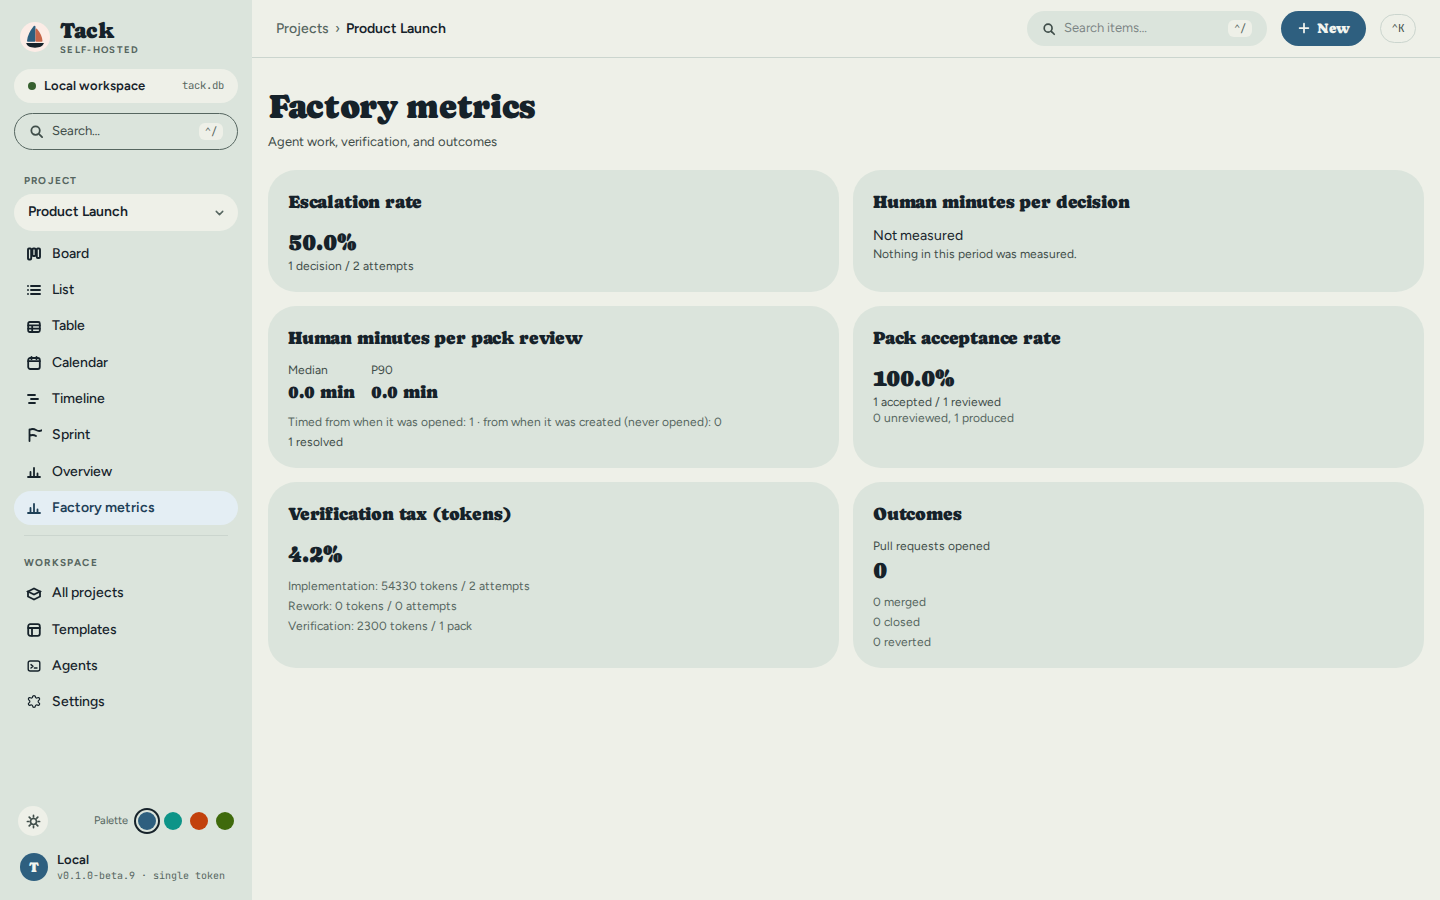
Tack has six work tabs — Board, List, Table, Calendar, Timeline, Sprint — all showing the same item set. Switching between tabs never re-fetches data; an item created on the Board appears immediately in every other view. Two more screens, Overview (Dashboard) and Factory metrics, are accessible from the sidebar and show project statistics.
Every view shares the same shell: a sidebar to switch project and view, a top bar with item
search and a + New button, and the command palette
on Ctrl+K. Theme and accent palette are set from the sidebar footer — see
Appearance.
Board
Kanban columns driven by the project's workflow statuses.
- Each column corresponds to one workflow status. Names, order, and WIP limits come from Settings → Workflow. Columns derive directly from the workflow — no "create a board" step is needed.
- Drag and drop a card to change its status. Changes save immediately with optimistic UI.
- WIP limit is shown in the column header when set. Dragging a card into a full column is blocked.
- Click a card to open the item detail drawer (Details, Fields, Dependencies, Activity, Files tabs).
- Add an item via the
+button inside a column header (pre-sets the status) or the toolbar + New button. - Board state syncs in real time via WebSocket — changes in one browser tab appear in another.
- Empty projects show a three-step onboarding checklist until the first item is created.
List
Sortable, flat or hierarchical table of all items.
- Flat mode (default): items sorted by creation date; use the sort dropdown to reorder by priority, status, or type.
- Hierarchy toggle: enable in the toolbar to indent items by
parent_id. Expand/collapse with the ▸ arrow. When every child of an item reaches a Done status, the parent auto-moves to Done — cascading up the hierarchy. - Inline create: click
+at any level to create a new item at that position. - Inline edit: click any field (title, type, priority, status) in the row to edit it.
- Bulk operations: check multiple rows, then use the bulk action bar to move all to a new status or delete them.
- Filter by status, priority, and type using the toolbar dropdowns.
Table
A dense spreadsheet view of every item — title, type, status, priority, assignee, and due date in sortable columns.
- Click a column header to sort by it; click again to reverse. Title, status, priority, assignee, and due date are all sortable.
- Filter with the search box — matches across title, assignee, and status as you type.
- Inline edit: click an editable cell (title, status, priority, assignee, due date) to change it in place; the edit saves immediately.
- Best for scanning or bulk-triaging a large backlog where the card layout is too tall.
Calendar
Monthly grid positioned by due date. Drag to reschedule.
- Items appear on the day matching their
due_date. Items without a due date appear in the No Date tray at the bottom. - Drag an item from one day cell to another to change its
due_date. Drag from the No Date tray onto a day to schedule it. - Navigate months with
←/→or jump to today. - Click an item to open the detail drawer.
Timeline
Gantt-style horizontal bar chart. Drag to reschedule.
- Each item with a
started_atand/ordue_dateis rendered as a bar spanning its date range. - Drag a bar horizontally to shift the date range. Drag either edge to resize (set
started_atordue_dateindependently). Changes snap to the active grid. - View modes: Week, Month, Quarter — toggle in the toolbar.
- Dependency overlay: items blocked by another item are marked with an indicator from the dependency graph.
- Scroll horizontally to see longer projects. Click a bar to open the detail drawer.
Sprint
Two-pane sprint planning surface.
- Left pane (Backlog): items not assigned to any sprint, sorted by priority.
- Right pane (Sprint lanes): one lane per sprint in Planning or Active state, showing capacity vs. commitment (story points), item count, and a done/total progress bar.
- Drag from the Backlog into a sprint lane to assign
sprint_id. Drag between sprint lanes to reassign. Drag back to the Backlog to unassign. - The server enforces the rule that items can only join sprints in Planning or Active state.
- Sprints move through four states:
Planning → Active → Review → Closed. Advance the lifecycle with the status buttons on each sprint lane header.
Overview (Dashboard)
Read-only project statistics — accessible from the sidebar.
- Throughput chart: items completed per time period.
- Status breakdown: item counts per workflow column with colour-coded category bars.
- Priority breakdown: counts by priority level.
- All statistics are computed live from the item set — no aggregation job.
Factory metrics
Read-only, per project — Factory metrics in the sidebar. It answers how well agent work is
going on this project: how often a run needed a person, how long the person took, what verification
cost in tokens, how often a merge-readiness pack was accepted, and how many pull requests agents
opened, merged, closed or had reverted. A card whose input does not exist yet says Not measured
and why, never 0; no card shows money. Every number, its definition and the counts behind it are in
Factory metrics in the Agent Runners chapter.